Content Review:
A Case Study in CX Analysis
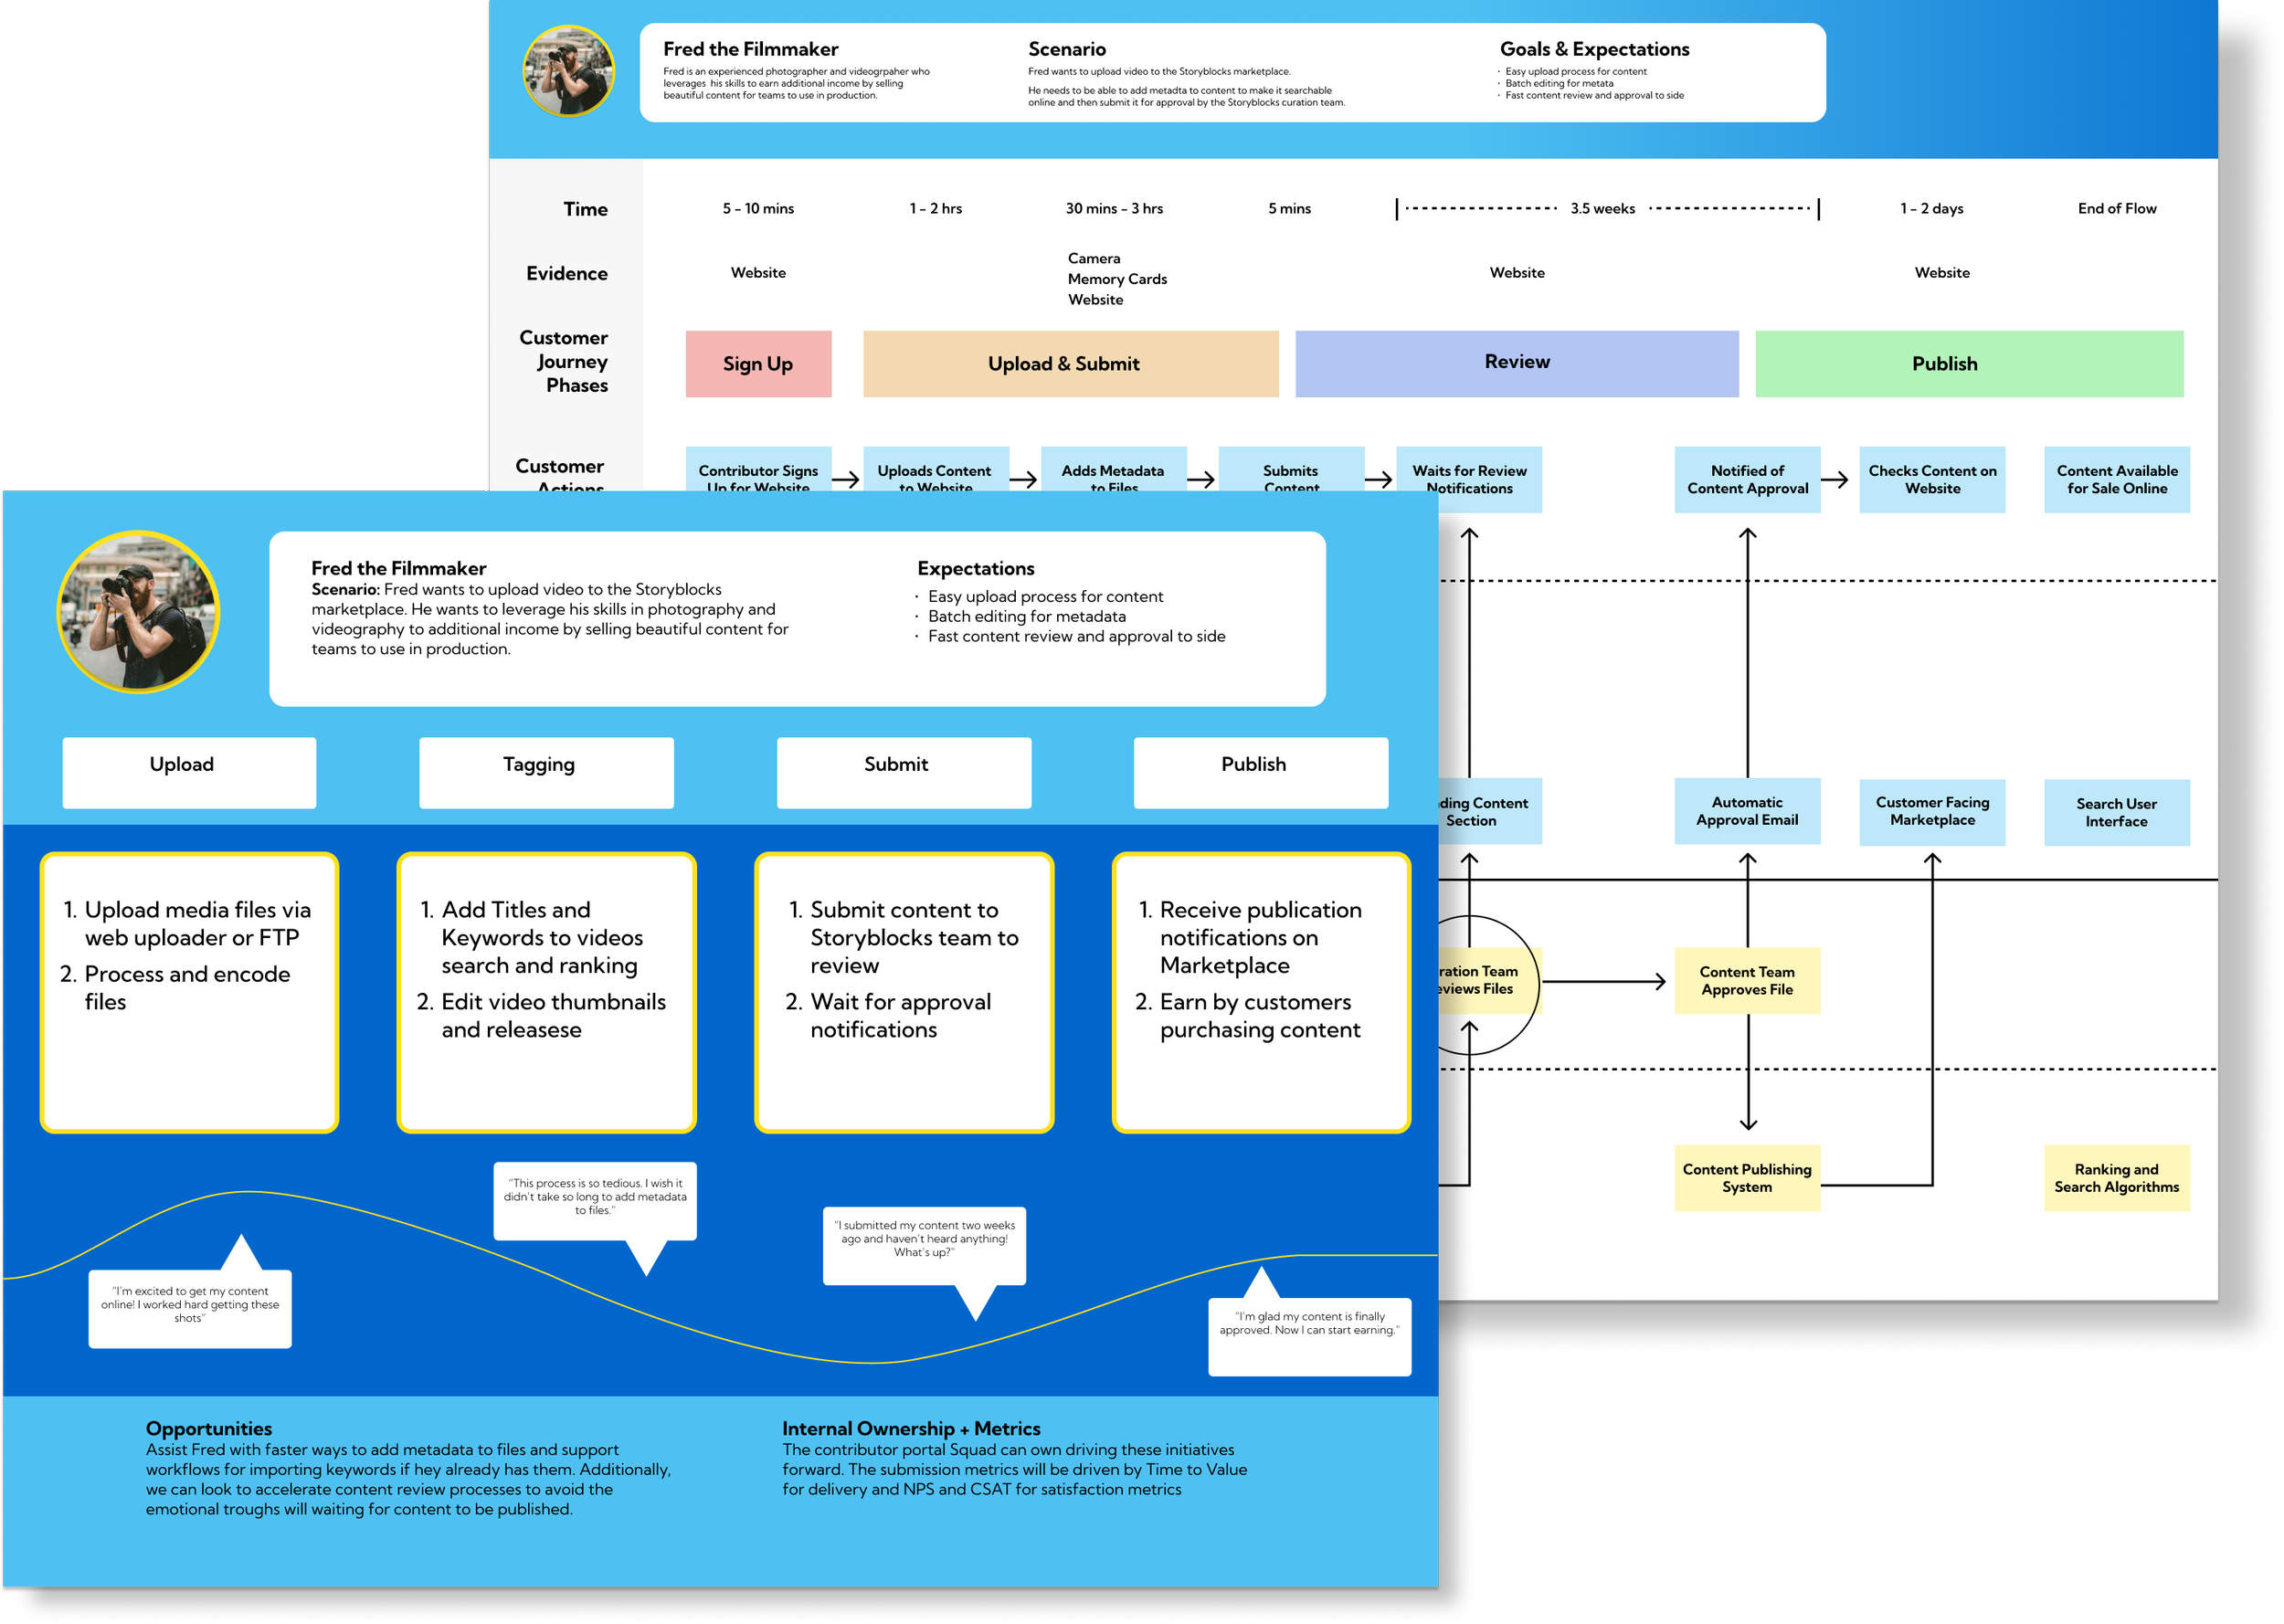
Table of Contents
Overview & Problem
Approach and Assets
Customer Journey Maps: Building Allies & Empathy
Service Blueprinting: The Rolling Ladder
Impact of Process: Fail Points & Opportunities
Results & Takeaways
01 - Overview & Problem
The Setup.
Previously, I worked at a stock media company offering videos, images, and audio for creators to download and use in their own projects. This company partnered with contributors across the globe who created and uploaded content to provide on the company’s hosted website for customers. During my tenure, we had some great success partnering with contributors to sell content to users. However, because the program was so successful, the volume of contributors and content coming in the door was growing exponentially.
The Rub.
As a stock media website, you have to review content before it’s published. But there’s a need to balance both the speed and quantity of files published to grow your offering, with the quality of content that is accepted, as this affects the quality of the product and brand perception.
A team of curators reviewed incoming submissions for the website full time. But we kept receiving more submissions. And more…and more…
Until the average time from content submission to approval was ~3-4 Weeks!
Competitors averaged ~one week to review content. This huge delay was causing friction with our primary partner audience, delaying their initial time to value, earnings potential, and loyalty with our company. So we went to work!

02 - Approach and Assets
We crafted the Problem Statement:
The average review time for content ranges between 3-4 weeks after submission. This delay creates frustration for our contributors and limits the rate at which we can offer new products to customers. The review team is currently understaffed and working at full capacity to review content as quickly and effectively as possible.
With a shared understanding of the problem, we built our goals in OKR format:
Objective:
Identify and test opportunities across the submission process to improve Content Review Time
Key Results:
Improve the Curation team’s baseline Average Number of Files Reviewed per Day by end of Q1
Reduce the Average Review Time to 1 - 1.5 Weeks by end of Q1
No adverse impact to Customer Net Promoter Score (NPS) or Monthly Recurring Revenue (MMR)
The Approach
Design teams need to set expectations early with stakeholders early regarding a project’s plan and outcomes. Then, build trust by consistently communicating progress delivering incremental value on a consistent basis. Start with a plan and know where you’re headed before a pencil starts to draw.
So, how might we use UX methods to approach this problem? Order of operations:
Establish customer Journey: Customer Journey Maps
Conduct Internal Journey: Service Blueprints
Quantify and Reinforce: Identify and Communicate Opportunities
Test and Measure: Test Hypotheses and Iterate

“Everything is a system”
- Don Norman
In order to effectively understand how to tackle a complex system, it’s critical to first step back and understand the holistic system. Oftentimes, it’s easy to overlook upstream or downstream impacts from a problem. As a UX professional, it’s our responsibility to both establish and communicate out how experiences and systems are interconnected. Artifacts like give us the tools to analyze and then educate. Once teams have a shared understanding of a holistic system, we can delve into problem solving.
SIMPLIFY
Simplify serve delivery and remove steps
STANDARDIZE
Service delivery to ensure consistent experiences
OPTIMIZE
Identify and optimize moments of truth or experience blockers
03 - Customer Journey Maps: Building Allies & Empathy
Any artifact should help drive towards 2 things: 1) Foster empathy 2) Build allies
We created a customer journey map outlining the contributors’ experience throughout the submission process - detailing user high’s and low’s throughout the journey. Visualizing the peaks and valleys in tandem with milestones allows stakeholders unfamiliar with the problem relate to the impact on people as well as create champions for an initiative.
As part of engaging stakeholders, UX professionals should always be communicating in the language most relevant to each stakeholder - many times this means rolling up UX initiatives to Measurable Business impact in order to create buy-in.
For the Review time initiative, we analyzed data from past surveys conducted by the UX team, identifying ‘Faster review times’ as the most important metric for contributors after sales, as well as correlations between contributor’s poor NPS scores and review times.
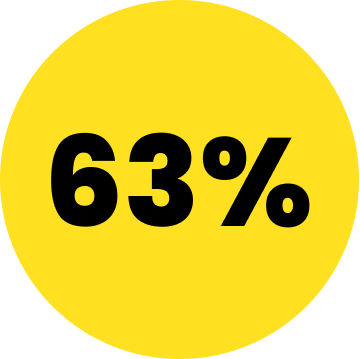
63% of contributors ranked ‘Review Time’ as the second most important time
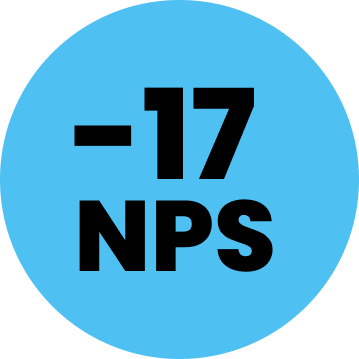
NPS scores were 17% lower on average from contributors experiencing longer review periods
Pairing visualizations with real quotes and data allows teams to triangulate the value to different audiences.
04 - Service Blueprinting: The Rolling Ladder
Service Blueprinting is a resource that drives understanding of a holistic system. It’s the map of the library layout as well as the rolling library ladder that allows the rider to move forward and backward, up and down the shelves to find a missing title.
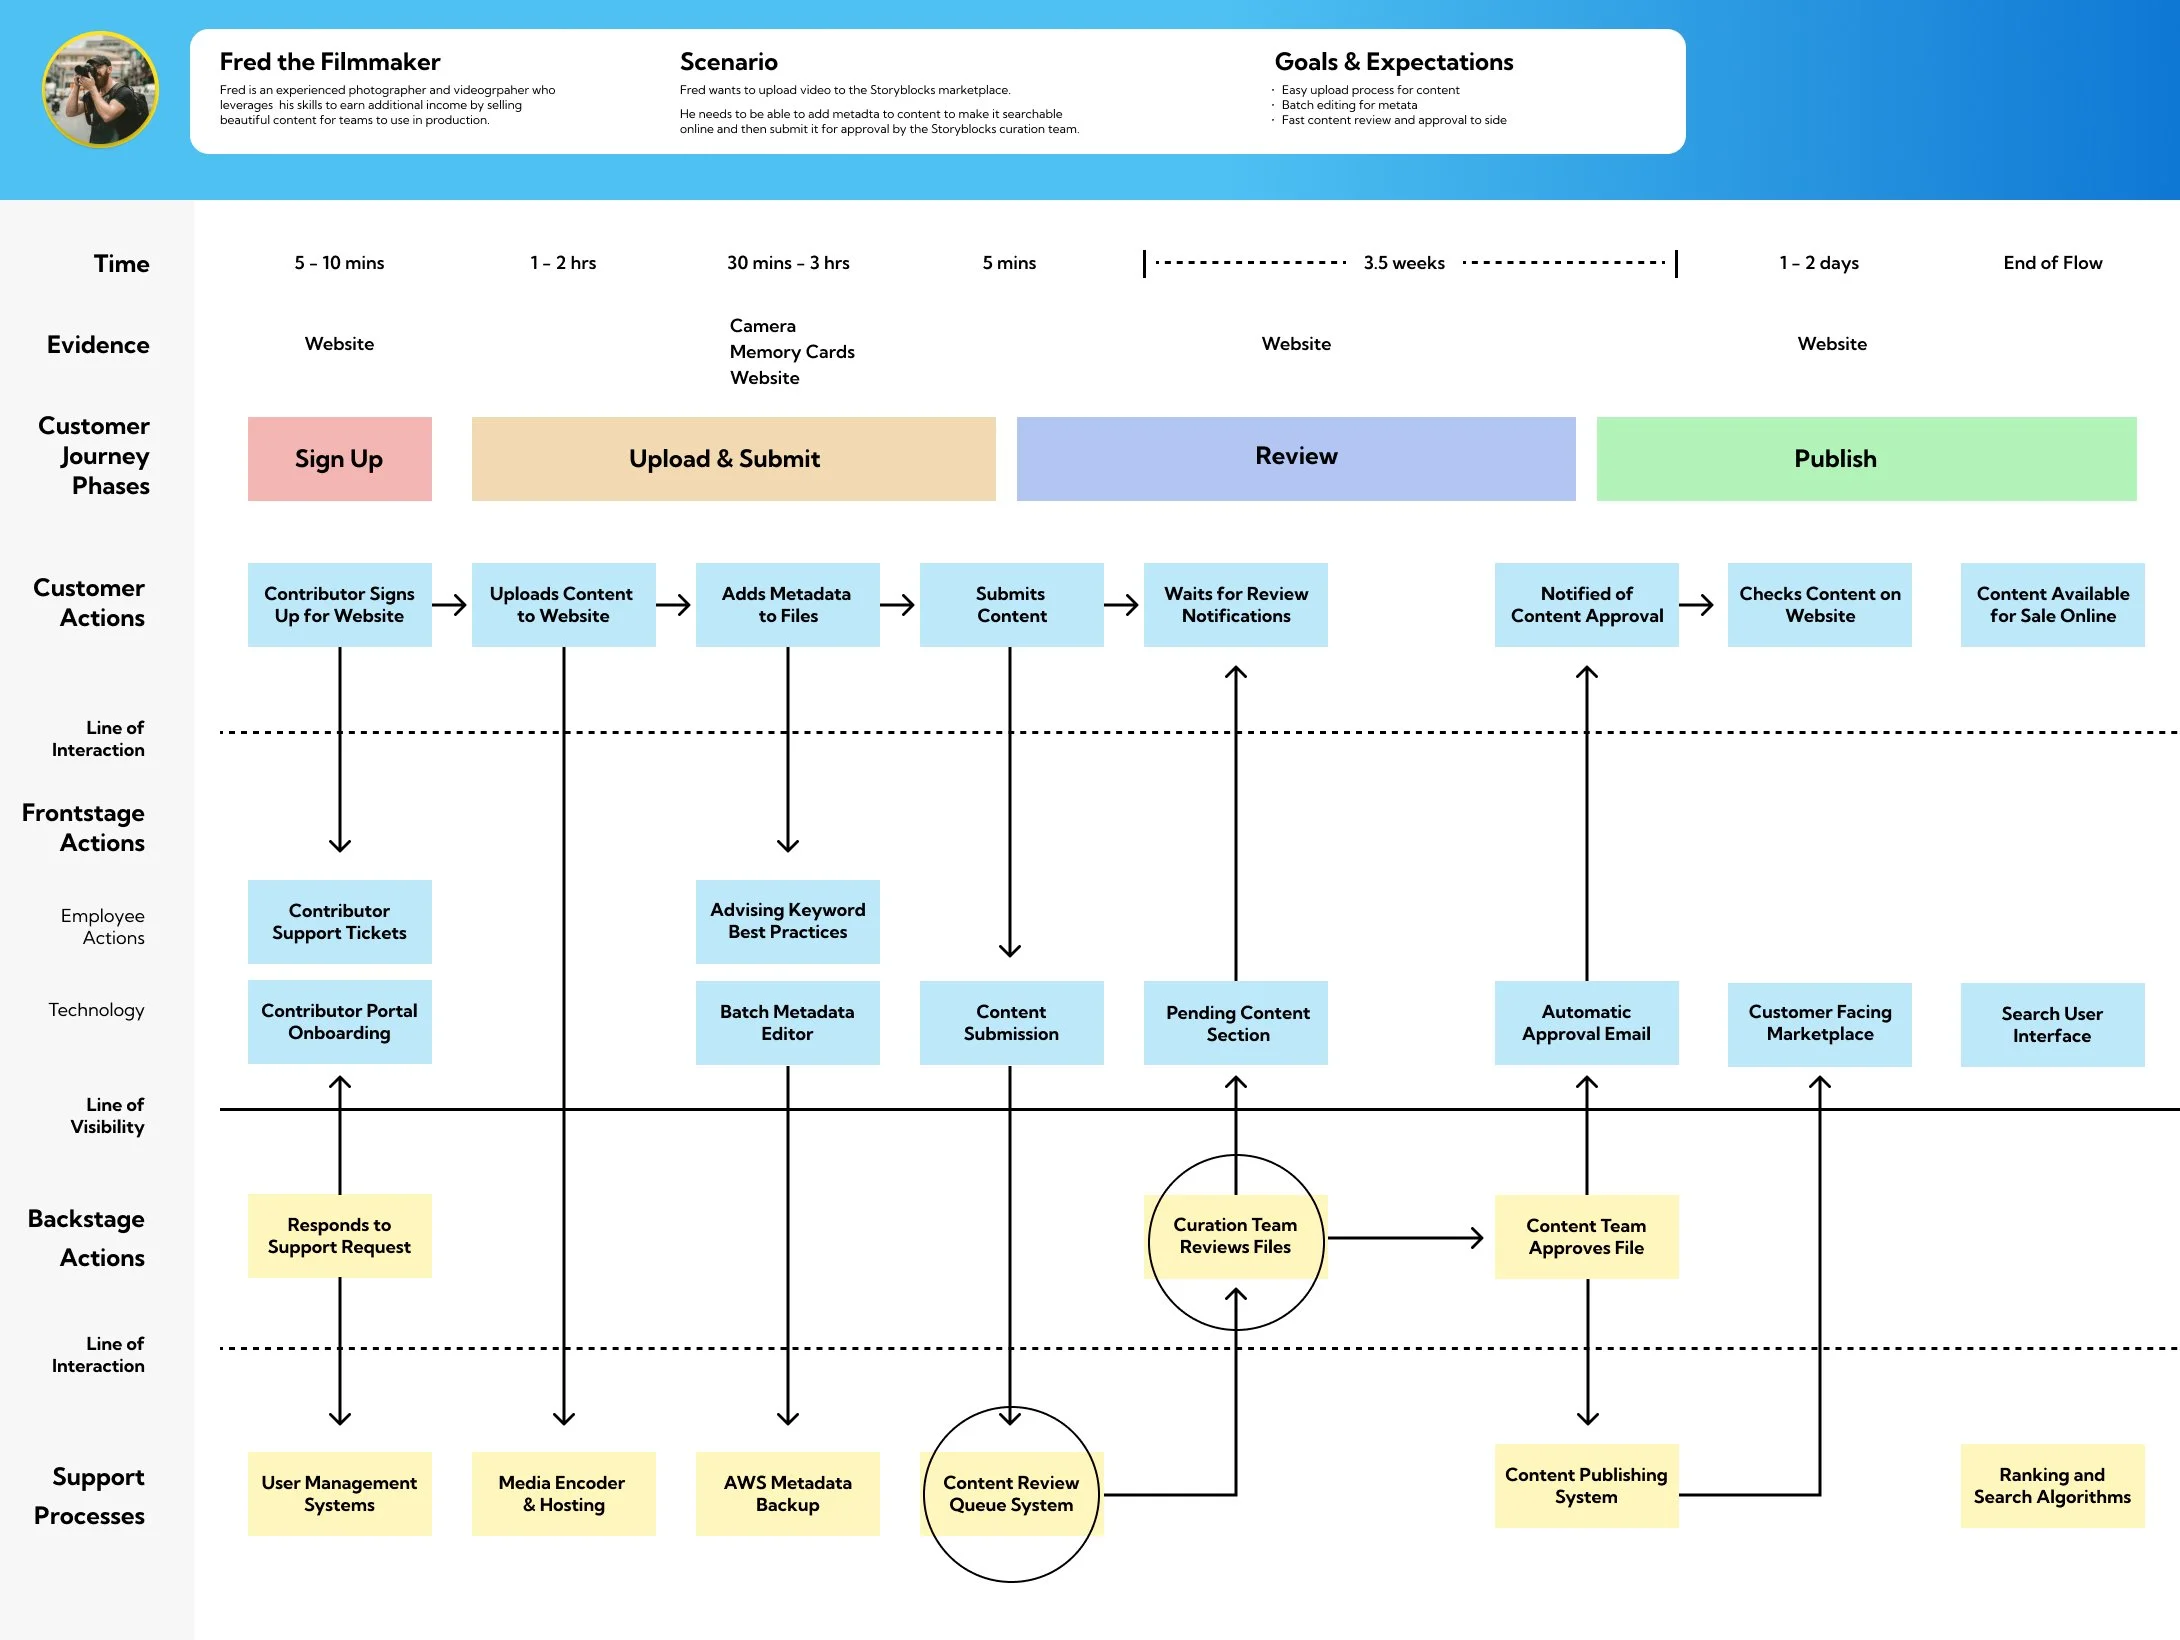
We built a Service Blueprint to connect the people, props, and process across the front and backstage actions in the review cycle.
It’s important designing a Service blueprint to define your scope - our parameters were A) First signup to B) File publishing in order to cast a wide net and drill down.

Design is simply the scientific method applied to technology. Service designers should approach constructing a blueprint in the same manner as running a test; letting data dictate the decisions instead of our own preferences. Easier said than done. But, to help dismantle one’s own assumptions, a Service Blueprint should be viewed first and foremost as a collaborative research initiative.
Talking with different groups of actors in a process is the only way to guarantee you accurately capture actions, stages, and linear dependencies between both people and systems.
After conducting interviews and contextual inquiry with our contributors, curation team, and working with engineering to understand our technical backend better, we broke our blueprint into 4 main sections: Customer actions, Frontstage actions, Backstage actions, and Support processes into the Blueprint Below: By mapping these out across time, we could clearly 1) Identify and 2) Visually communicate fail points in the process and find some missing titles from our library’s collection.
05 - Impact of Process: Fail Points & Opportunities
The Blueprint artifact makes problems (even obvious ones) more tangible for teammates. We shared this resource as a follow on to the Customer Journey Map as the next logical step to addressing user pain points, gaining traction and proving the methodology to stakeholders.
This is where it’s critical to analyze the inputs and outputs related to the failpoints and ask Why 5 times. In this case, it was asking ‘Who.’
During our interviews, a reviewer identified that many of the files they approve are from repeat contributors. We analyzed the submission trends and had an incredible insight:
The majority of files reviewed were from contributors with high approval rates and sales!
Meaning that we were spending 80% of our time and costs on content that had proven itself to be trustworthy and generate revenue, but was still backing up everything else.
“We spend a lot of our time going through the same submitters.” - Amazing curator

Most of our review time was being spent on creators we already knew.
THIS is Why Blueprinting cannot be done in isolation. Co-design and input from stakeholders will bring new data and unlock insights. And why research must inform artifacts. In this case, it created an opportunity to reallocate our resources more effectively.
06 - Results
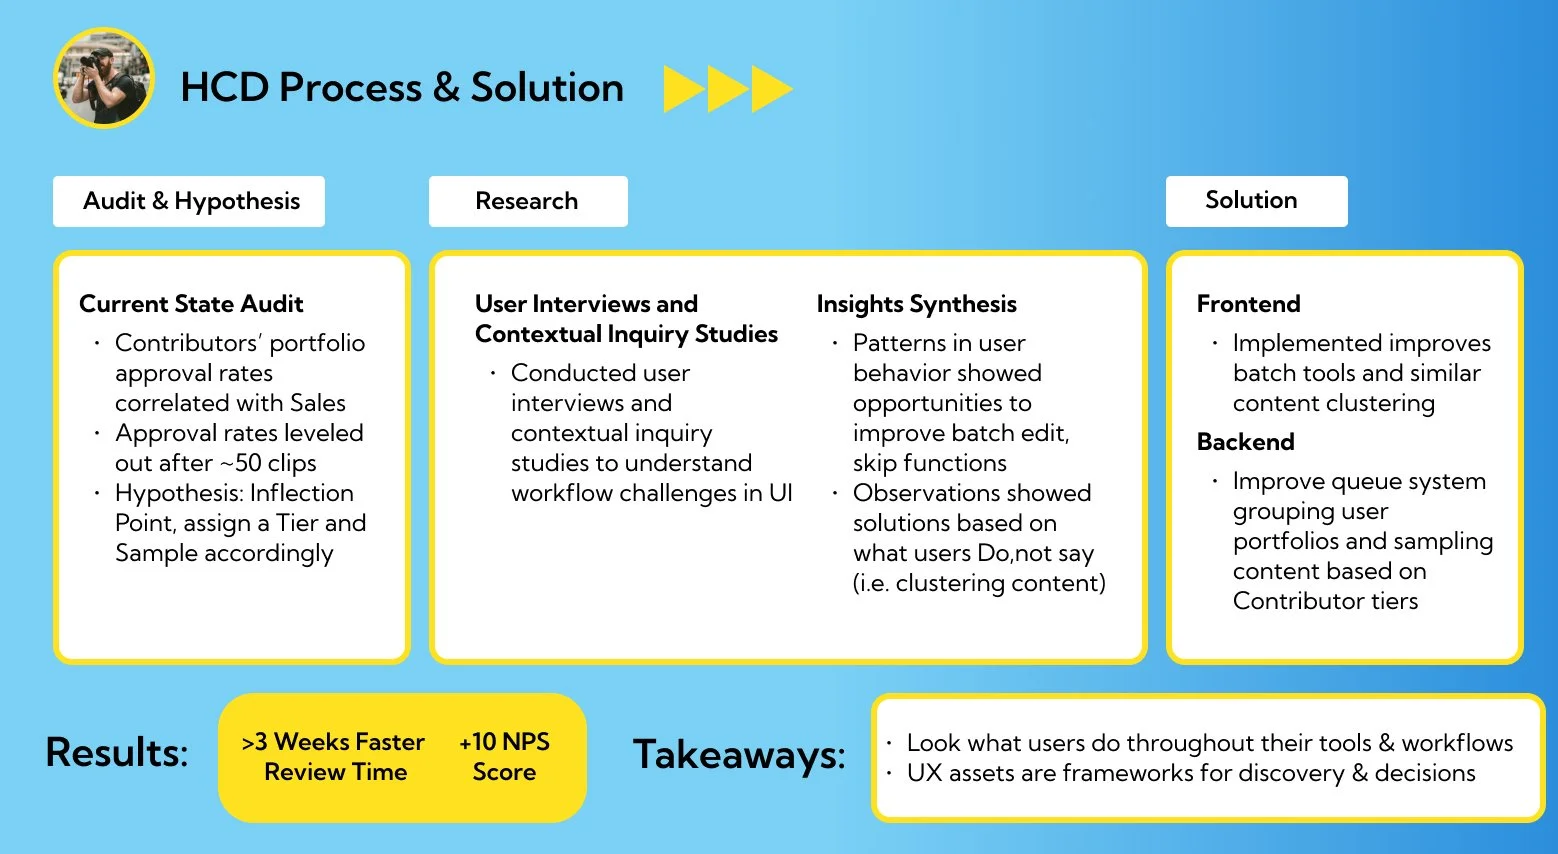
The implementation stage of Blueprint learnings should always start the same to change processes: Simplify, Standardize, Optimize. After digging into the data, we implemented the following changes and monitored outcomes:
PROCESS
Addition of new Queues based on Tiers of Performance (approval rates, sales, etc.)
PROPS (Backend updates)
Worked with Data scientists and engineering to introduce a new Tiered sampling rate to allocate a percentage of content being reviewed by curators based on Queue - ensuring that curators spent More time reviewing unverified content, and less time reviewing trusted content
Updates of Bulk curation tool usability based on Contextual inquiry findings
PEOPLE
Updating training for reviewers on new process
Updating communications for Contributors, adjusting language to better set expectations and overdeliver when possible

So, what was the impact?
KEY RESULTS
Average Review Time reduced from 3-4 weeks to 5.5 days
Improved Contributor NPS scores on Average by +10 points
Feature requests addressed for review team & review cost savings
No adverse change in Customer NPS
… Not to mention happy stakeholders, and increased trust in UX team for the next initiative

Takeaways
Create with the End in Mind
UX teams can leverage Customer Journey Maps and Service Blueprints to communicate issues and spark new ways of thinking about existing systems. However these should always be integrated into a larger plan, from establishing end goals, to building allies, to measuring outcomes.
You Need Humans & Numbers
Data and people must work together to find the optimal solution. Always look for different avenues to tackle known fail points and opportunities. Analyzing both quantitative and qualitative information shows different perspectives, each with their own unique value.
Systems. Serve. People.
At the end of the day, systems serve people. Don’t forget about the Why behind the larger puzzle - prioritize understanding upstream and downstream impacts of changes on the people these systems serve.